The first time I heard the name “Support Vector Machine”, I felt, if the name itself sounds so complicated the formulation of the concept will be beyond my understanding. Luckily, I saw a few university lecture videos and realized how easy and effective this tool was. In this article, we will talk about how support vector machine works. This article is suitable for readers who do not know much about this algorithm and have a curiosity to learn a new technique. In following articles we will explore the technique in detail and analyze cases where such techniques are stronger than other techniques.
What is a classification analysis?
Let’s consider an example to understand these concepts. We have a population composed of 50%-50% Males and Females. Using a sample of this population, you want to create some set of rules which will guide us the gender class for rest of the population. Using this algorithm, we intend to build a robot which can identify whether a person is a Male or a Female. This is a sample problem of classification analysis. Using some set of rules, we will try to classify the population into two possible segments. For simplicity, let’s assume that the two differentiating factors identified are : Height of the individual and Hair Length. Following is a scatter plot of the sample.
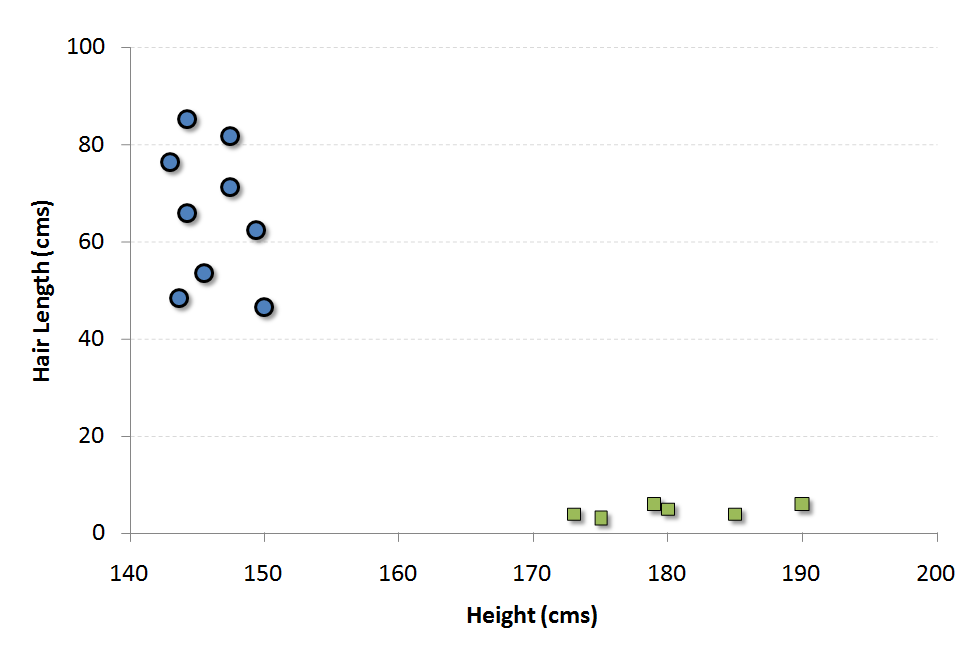 The blue circles in the plot represent females and green squares represents male. A few expected insights from the graph are :
1. Males in our population have a higher average height.
2. Females in our population have longer scalp hairs.
If we were to see an individual with height 180 cms and hair length 4 cms, our best guess will be to classify this individual as a male. This is how we do a classification analysis.
What is a Support Vector and what is SVM?
Support Vectors are simply the co-ordinates of individual observation. For instance, (45,150) is a support vector which corresponds to a female. Support Vector Machine is a frontier which best segregates the Male from the Females. In this case, the two classes are well separated from each other, hence it is easier to find a SVM.
How to find the Support Vector Machine for case in hand?
There are many possible frontier which can classify the problem in hand. Following are the three possible frontiers.
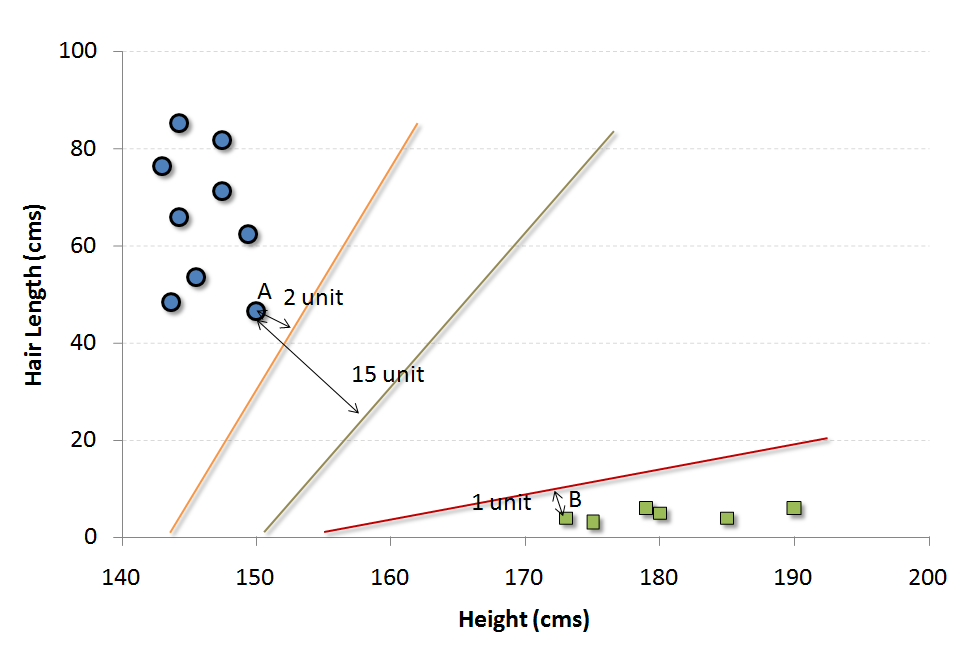
How do we decide which is the best frontier for this particular problem statement?
The easiest way to interpret the objective function in a SVM is to find the minimum distance of the frontier from closest support vector (this can belong to any class). For instance, orange frontier is closest to blue circles. And the closest blue circle is 2 units away from the frontier. Once we have these distances for all the frontiers, we simply choose the frontier with the maximum distance (from the closest support vector). Out of the three shown frontiers, we see the black frontier is farthest from nearest support vector (i.e. 15 units).
What if we do not find a clean frontier which segregates the classes?
Our job was relatively easier finding the SVM in this business case. What if the distribution looked something like as follows :
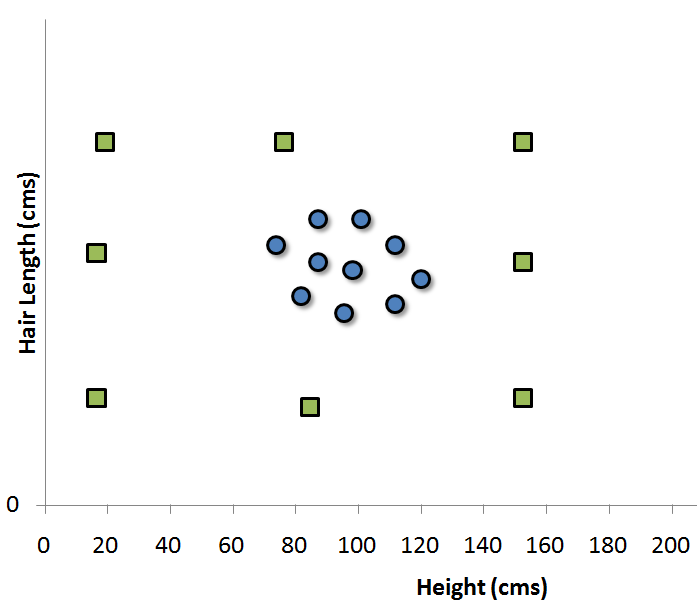
In such cases, we do not see a straight line frontier directly in current plane which can serve as the SVM. In such cases, we need to map these vector to a higher dimension plane so that they get segregated from each other. Such cases will be covered once we start with the formulation of SVM. For now, you can visualize that such transformation will result into following type of SVM.
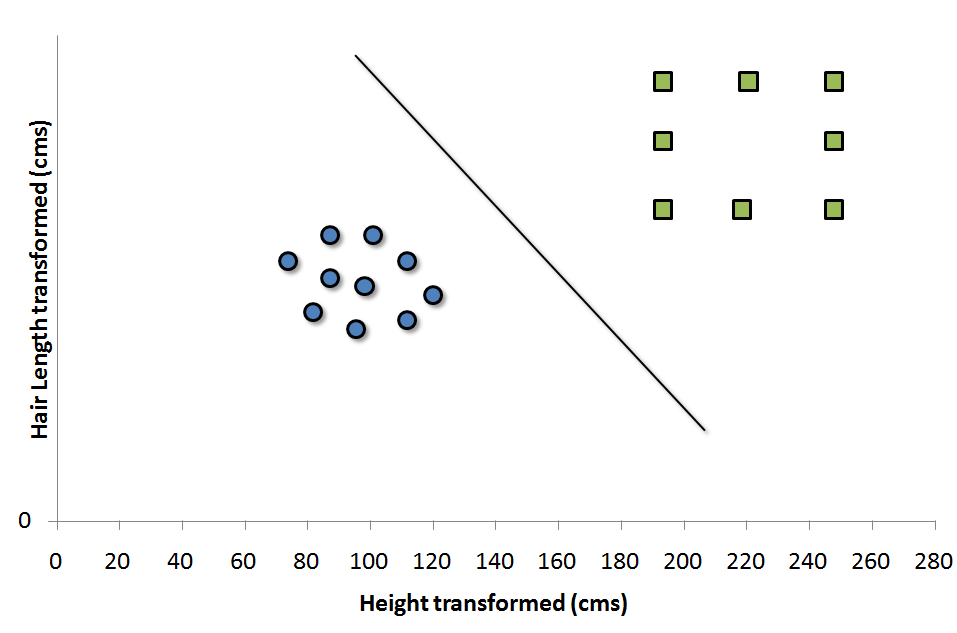
Each of the green square in original distribution is mapped on a transformed scale. And transformed scale has clearly segregated classes.
No comments:
Post a Comment